Housing 2: Food and the
remaining carbon budget
Written for a housing policy forum. Part 2

To recap on the topic carbon budgets mentioned in the first note:
“The fifth assessment report of the Intergovernmental Panel on Climate Change (IPCC AR5 – in 2013) was the first to include an assessment of a “remaining carbon budget” – a finite amount of carbon that can be burnt before it becomes unlikely we can avoid more than 2°C of global warming. Later they issued a budget for 1.5°C, which Carbon Brief updated in Six years worth of current emissions would blow the carbon budget for 1.5 degrees. – according to these calculations this is now five years.”
The next few notes will discuss how housing determines – to a significant extent – the nature of our life-styles and how this drives emissions of greenhouse gasses. This particular note is about food.
In 2006, with support from Unltd, the millennium charity, I set up the Green Ration Book website to inform visitors of the details of carbon emissions caused by their everyday activities. It was a precursor to Mike Berners-Lee’s excellent book, How bad are bananas? Both gave advice on the climate impacts of everyday living. How bad are bananas says
“Climate change is upon us whether we like it or not. Managing our carbon usage has become a part of everyday life and we have no choice but to live in a carbon-careful world. The seriousness of the challenge is getting stronger, demanding that we have a proper understanding of the carbon implications of our everyday lifestyle decisions. However most of us don’t have sufficient understanding of carbon emissions to be able to engage in this intelligently.”
Many of our day-to-day activities, which generate carbon emissions can be related to locality where we live are: housing, food, transport and waste policy. My first note dealt with the carbon emissions from building houses. This note moves on to discuss the role of food and food production and associated carbon emissions.
Food consumption is a large part of our carbon emissions. Emissions caused by livestock are large (See Appendix 1) but other foodstuffs, particularly produce flown in by plane, can have a very high carbon footprint too.
The Green Ration Book assumed a target for a personal carbon ration of 2.2 tonnes of CO2 per year based on targets set for 2050 in the UK’s climate act of 2008. (The targets set in the 2008 Act exceed the UK’s “fair” share of the remaining carbon budget. See Appendix 2). A ration of 2.2 tonnes CO2e per year approximates to 6 kg per day. The Green Ration Book allocated this to 4 classes of activity: building, food, travel and government activity. Each activity was allocated 1.5 kg CO2e per day.
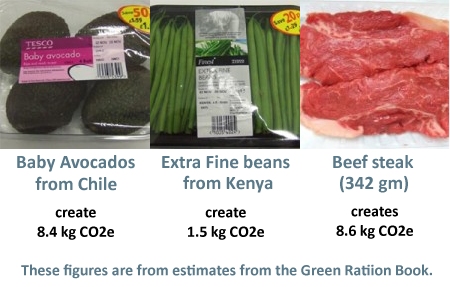
Some examples of the footprint of food from the Green Ration Book:
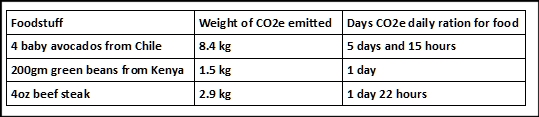
Thus the Green Ration Book estimates that 200 gm of green beans from Kenya fulfills one person’s personal carbon ration for food for one day.
Although learned bodies such as the Royal Society have published information on the carbon footprint of food, consumers are only vaguely aware of its climate impacts. Even if the estimates in the Green Ration Book are rough and ready, it is clear that avoiding climate disaster will require large changes in food production and consumption. The common explanation of footprints using the concept of air miles is not the only consideration. Although the CO2e emitted by air freight for some foods easily break personal carbon budgets there are other sources of greenhouse gas emissions: The methane emitted by ruminant livestock (cows, sheep, goats &etc.) have a large impact and most of the food we eat has been fertilised by nitrogen compounds derived from the energy intensive Harber-Bosh process:
“Due to its dramatic impact on the human ability to grow food, the Haber process served as the “detonator of the population explosion”, enabling the global population to increase from 1.6 billion in 1900 to today’s 7 billion. Nearly 80% of the nitrogen found in human tissues originated from the Haber-Bosch process. Since nitrogen use efficiency is typically less than 50%, farm runoff from heavy use of fixed industrial nitrogen disrupts biological habitats.”
A move to organic farming methods, which avoid energy-intensive fertilisers, can reduce the carbon footprint of food, especially if grown locally. The Food and Agricultural Organisation’s web-page, Evaluating the potential of organic agriculture, says:
“A shift to organic agriculture brings about significant change. First, the composition of the inputs changes. Together with a reduction in the use of synthetic fertilizer and pesticides, an increase of other inputs can occur, such as organic material, labour and machinery.”
There are also technological solutions, such as food produced locally under LED lighting, which may have some potential for good-quality food grown with low carbon emissions. Both these approaches can cause much less carbon emissions than agriculture based on the Harber-Bosh process. To get good yields conventional organic farming may require more labour but if labour productivity is an issue, we need to look to the robots to help. I will discuss the issue of workers vs. robots later. Feeding the world using more labour intensive agriculture or emerging high-tech systems of food production may mean the atmosphere polluting Harber-Bosh process can be retired.
There is another issue relevant to feeding the world. So-called advanced societies tend towards the consumption of foods that are resource intensive: As income rises people switch from simpler foods, like wheat, maize, rice and vegetables to ‘luxury foods’, such as beef and lamb. This takes up much more agricultural land and creates much more pollution. The world has the capacity to feed many more mouths if less food were fed to livestock and was eaten directly by humans. (See Appendix 3: Superior and inferior foods.) And of course there is the perennial food waste issue.
We should also shorten the food chain at a time when its just-in-time methodology makes food security a very high priority. In A Food Brexit: time to get real Professor Tim Lang says:
“Food security. . The UK’s home production has been steadily declining. The UK food system ought to be improving its resilience. It isn’t. It’s like the rabbit caught in the headlights – with no goals, no leadership, and eviscerated key ministries.”
New housing settlements are an ideal opportunity to cut the carbon emissions from food production, create local employment and increase our food security. This could mean integrating into housing schemes things like market gardens and shops that guide consumption, shorten food chains and increase food security. We need a drastic change in thinking in the ways we grow, transport and consume food. Possibilities for planning and economic mechanisms to address these issues, I will consider how such considerations might be integrated into out current planning system and economic organisation in a later note. The next note will discuss transport.
Appendix 1: Carbon emissions from livestock.
The United Nation’s Food and Agricultural Organisation (FAO) highlighted livestock’s impact on the environment in Livestock’s long shadow: environmental issues and options. This estimated that livestock causes 18% of total greenhouse gas emissions. However, a report by the Worldwatch Institute, Livestock and Climate Change, claim that livestock and their by-products actually account for 51 percent of annual worldwide GHG emissions. The report authors were previously employees of the World Bank. The Agricultural and Horticultural Development Board tell a different story in Livestock and Climate Change: The Facts, they point out that the FAO have revised their estimate down to 14.5% of global emissions.
The truth is probably hard to extract from these and other competing claims: There are difficulties with the meaning of the terms used – or (as system scientists would say ) “defining system boundaries”. There are different assumptions made in these claims. One of particular note is the relationship between carbon dioxide and methane. Those that minimise the carbon footprint of livestock chose methane to be 25 times as powerful as carbon dioxide while others choose to use a factor of 84. This is not the only difference in accounting.
Appendix 2: sharing the remaining carbon budget
From World Wide Carbon Fee and Dividend:
Worldwide personal carbon budget: 33 tonnes CO2e (or if we risk 2˚C it’s 115 tonnes)
Carbon Brief reports the remaining carbon budget to give a 66% chance of keeping global warming below 1.5˚C as 243 billion tonnes. That means, if humanity emits 243 billion tonnes more of CO2e global temperature will rise to 1.5˚C above pre-industrial. Using the same calculations, the remaining carbon budget to keep below 2˚C is 843 billion tonnes.
World population was estimated recently at 7,317,801,293 by Worldometers. Dividing Carbon Brief’s remaining carbon budgets by the world’s population sets the remaining worldwide personal carbon budget at a maximum of 33 tonnes CO2e for a 1.5˚C rise or 115 tonnes for a 2˚C rise.
UK emissions: 20 tonnes CO2e per person per year
In a little noticed corner of a report by the Committee on Climate Change, Reducing the UK’s carbon footprint., there is a table showing that the UK’s carbon emissions per person are about 20 tonnes CO2e per year.
On these figures the UK runs out of its ‘fair share’ of the remaining carbon budget for a 1.5˚C global temperature rise in just over a year and less than 4 years for a 2˚C rise.
Appendix 3: Superior and inferior foods
From It’s the poor that starve:
Inferior foods and luxury foods in an artificial world.
The poor will consume foodstuffs that are what economists call inferior goods:
“In consumer theory, an inferior good is a good that decreases in demand when consumer income rises, unlike normal goods. Normal goods are those for which consumers’ demand increases when their income increases. The [inferiority of inferior goods] is an observable fact relating to affordability rather than a statement about the quality of the good.”
Without being too prescriptive about the meaning of luxury goods, we can say that as income rises people switch from inferior goods to luxury goods. One problem for the poor comes when luxury goods use inferior goods as the raw material or compete for the resources that used in the production of inferior goods. If the poor have incomes that cannot compete they may not be able to afford even inferior goods.
Consider a world where there are only two types of food: cereal grains (wheat, maize & etc) and beef and a population of seven billion people. And where cereal production is 2300 million tonnes per year or just over 900 grammes per person per day. That provides an average of about 3200 calories per person per day – about enough. But what if half those grains were used to feed cattle for beef. The conversion of grain to beef would loose, say, three quarters or more of the calories in the grain so the average person now has only 1875 calories per day – 1500 calories from grain and 375 calories from beef – not enough.
Geoff Beacon 11th September 2017
