Housing – part 11: No cars in the city
Written for a housing forum
The Carbon Budget Morality Index
In the following sections, I assume a rule of thumb that a decent, morally justified lifestyle must keep with a total budget of 100 tonnes CO2e for the next 50 years. This is the basis for the Carbon Budget Morality Index (CBMI) discussed in Are you evil or very, evil?. The 100 tonnes 50 year budget is classed by the CBMI as ‘shameful’ but at least it’s morality index is below the CBMI ‘evil’ level. In this post the ‘shameful’ level will be referred to as CMBI-s level.

Mass car ownership cannot be sustainable or fair
That heading is all the informed reader need read. The informed reader will already have ‘got it’ but for those that want to argue there’s this ‘small print’.
Carbon budgets and local pollution
Part 3: Carbon budgets and transport, gave the yearly emissions for one fossil fueled car as 2 tonnes CO2e. This adds to the CO2 emitted by the car’s manufacturer – 7.4 tonnes CO2e. Writing in The Guardian, What’s the carbon footprint of … a new car?, Mike Berners-Lee gives higher figures for specific cars:

Research suggests that the saturation level of car ownership is about 80%, (i.e. 80 cars per 100 people) although in the UK it’s now about 40% (25.8 million cars to 65.4 million people in 2015)
Over 50 years, 2 tonnes a year of CO2e from a car powered by fossil fuel gives a total of 100 tonnes. During this time, 3 new cars will be required. The figures from Mike Beerners-Lee suggests the manufacture of an ‘average car’ causes about 18 tonnes CO2e ((6+17+33)/3). Allowing for three new cars in the CBMI 50 year time frame, gives nearly 50 tonnes more – adding in a small amount for car maintenance. This is 150 tonnes CO2e per car.
At 80% saturation levels of car ownership, this is 120 tonnes CO2e per person – well over the 100 tonnes CBMI-s level.
The Green Ration Book allocated a quarter of personal carbon emissions to transport. The other three quarters were allocated to consumables, building and government. If the same division of carbon emissions is used to the CMBI-s level of carbon budget, the CBMI-s-transport is 25 tonnes CO2e. Even the assumption that cars could become zero carbon within fifty years (at a steady rate of decline) adds up to a level of emissions totalling 60 tonnes CO2e per person, more than twice the the level for the ‘shameful’ budget for transport in the CBMI.
Electric cars are often presented as a way of cutting carbon budgets, but at present they are powered by electricity that won’t be zero carbon for a long time, and their manufacture is carbon intensive. Also they are expensive – placing an economic burden on the motorist and non-motorist alike.
The wear on the tyres of electric cars are polluting local atmosphere and the oceans. Fossil fuel cars do as well but electric cars are heavier so cause more tyre wear. Locally in your town and city all cars are causing pollution.
There are three parts to the rest of this post:
1. Highway robbery, 1991
A reconstruction of something I wrote in 1971 – from scraps of old, yellowed paper.
2. York Inner Ring Road Enquiry, 1972
Parts of my evidence to the Enquiry.
3. European Commission: Car-free cities, 1992
A note about a study for the European Commission.
The message from these pieces is that settlements that contain cars are sprawling, polluting and expensive.
Highway robbery – 1971
(Slightly rewritten to improve its readability.)

Once upon a time children played in the streets outside their houses, cycling clubs would go out for a spin in the country at the weekend and people would walk around or stop and talk in the city centre streets or their local high street. Now traffic has taken most of the space that was used for these activities. It has, in fact, completely taken over the major supply of easily accessible communal land – the public highway.
It is this gradual and largely unnoticed take-over of this public space that has hidden one of the main disadvantages to mass car transport: the large amount of space required.
Modern town planners are now setting aside areas which can hold the activities displaced by the car: 0n the housing estates they are providing ‘minor open space’; in suburban areas they are providing playing fields and parks; in the city: the shopping precinct.
But today’s ‘minor open space’ isn’t quite the same as the street before mass car use. It is often the land left over after houses and roads have been put on the plans. It becomes a self-conciousness, unnatural space which fails to develop the rich activity pattern of the old-fashioned street. These communual ‘spaces’ are less easily accesible than the car-less streets that were once safe to play and meet on.
What area of towns do we loose to cars?
In 1968, the Urban Planning Directorate of the Ministry of Housing and Local Government analysed the amount of land used on estates that provided for the separation of cars and pedestrians. Using eight medium density estates, they found that providing space for 1.25 cars per dwelling (one car to 3.5 People) needed these areas of land:
 The land on these estates was roughly one part each for: houses, gardens, open space and cars. There are three main reasons why the land set aside for cars is even worse than it appears:
Firstly, unlike the land taken for houses and gardens, the car space must be continuously connected and so it presents many barriers to a direct pedestrian movement;
Secondly, cars are dangerous and care must be taken in the spaces they use (especially by children):
Thirdly, in the estates studied the number of cars er dwelling was not especially high – nor were these high density estates. In fact, The Road Research Laboratory predicts car ownership will saturate at almost twice the level of the estates studied.
One of the injustices of present government policy is that it discourages new estates with less than one car per dwelling. This leaves non-motorists in a difficult situation because they have nowhere to live designed specifically to meet their needs. Instead, they must live somewhere where the cost of providing for motor cars is shared with car-owning residents. They must also suffer the danger and nuisance caused by cars and must do without the services generated by pedestrians, such as good public transport.
Traffic statistics from Professor Smeed
At his inaugural address, on the 23rd October 1967, at University College, London, Proffessor Smeed gave a paper on the problems of Urban congestion. He gave the following estimate of the area that peak hour commuters need for their cars while they are actually on the road:
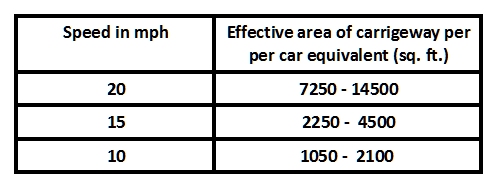
What is notable is the large amount of space cars need when moving. Even at slow speeds the space required is ten times more its footprint when stationary. Initially this seems unlikely but in congested towns and cities, traffic is bunched and frequently stopped at one junction but around the corner the road is temporally clear.
The planning for the movement of motorcars creates a sprawling effect on the design of housing estates and city centres fills the streets .
Evidence to the York Inner Ring Road Enquiry 1972
SECTION 2. Analysis & Alternative strategy
2.0 The problem is that of designing an environment for people, who occupy a few square feet and need tens of square feet to move (2.0/1), which can also accommodate a large number of motor cars, which occupy hundreds of square feet (2.0/2) and need thousands of square feet to move(2.0/3). This has consequences for housing design (2.0/4) and for urban form (2.0/5). There are also other characteristics of motor cars which damage the local environment so that a large number of them in an urban setting has the effect of encouraging people to spread out spatially in trying to avoid the nuisances of heavy traffic (2.0/6).
2.1 The town designed and developed without the motor car has many advantages for people with a low vehicle use (2.1/1) and because they do not require large areas of transportation space (and there is less need to withdraw from traffic nuisance) they can be denser than towns developed for mass motor car transport for the same environmental standard.(2.1/1a). This brings, of itself, many advantages of accessibility of urban facilities (2.1/2). Further, these facilities can be grouped together in such a way to increase accessibility over that possible with the high vehicle use of mass motor car transport after the simple density effect has been discounted. (2.1/3)
2.2 Within a low vehicle usage town, whilst they are in a minority, individuals with a high vehicle use can benefit from the facilities generated by the low vehicle use structure (2.2/1) as long as they do not have to bear their external costs. Since, at present, this is the case, when the number of people with high vehicle use increases within such a town, the town is gradually reshaped to become one more suited to high vehicle use (2.2/2). This reshaping is a very painful process (2.2/3) and the public are not all happy with the end result (2.2/4) and a very high cost in resources will have been paid (2.2/5).
2.3 There is the following important point to note: the two types of town never exist simultaneously; one being created from the other by external costs of people with high vehicle use, who parasitically use the facilities of the pedestrian towns whilst helping to destroy them (2.3/1). Thus the public is never presented with a choice between a low vehicle use town with all its facilities and a high vehicle use town with the facilities it can provide.
2.4 Those people that realise that this is happening are often seduced into high vehicle use (at the expense of others (2.4/1)) admitting their part in the decay of the low vehicle use town, not being able to resist the lure of their own private gain when they see others grabbing their share. Those people who are in ignorance of the process simply so things which are to their own personal advantage without considering the wider consequences.
2.5 In York’s case there is an enormous reduction in the quality of life in the inner residential areas (2.5/0) due to heavy traffic. A considerable proportion of high vehicle use comes from the higher social and income groups, many of whom live outside the city and commute to York in their cars, thus imposing enormous external costs (2.5/!). There is also a considerable number of people aspiring to achieve a cheaper version of this suburban dream (2.5/2). I often wonder whether these people, in particular, are aware of the burden they place on the low vehicle use groups. York suffers from the mentality which I really must sadly call that of the Poppleton parasite and the aspiring Poppleton Parasite.
2.6 If a true choice were given between high vehicle use and all the consequences of its urban form and low vehicle use and the consequences of its urban form some will choose one, others the other. (2.6/1). The difficulty of providing for both of these groups in one homogeneous structure leads me to suggest a policy of separate spatial development.
2.7 In York, this policy could be effected by designating certain areas as areas of low vehicle use. These areas would, at first, probably be some of the older residential areas, which were built for low vehicle use. At present vehicle ownership is fairly low in these areas, especially amongst the stable population (2.7/1). In these areas, vehicle use, particularly of the private motor car, would be severely restricted; the justification for this being the high external cost of vehicle use in these areas (2.2/3). In other areas, more suited to high vehicle use, the external costs being lower, there would be less need for restrictions.
2.8 In this situation, if the tendency were towards an increase in vehicle use as a whole (2.8/1), then we should try to accommodate this change by changing low use areas to high use areas as they come up for natural redevelopment (2.8/2). This would also have the advantage of preventing the premature decay of some of the environment and housing stock of York’s older residential areas.
2.9 This leaves the problem of treating those facilities which are jointly used by high vehicle use and low vehicle use groups. In this case it probably best to resort to cost-benefit analysis techniques (which must be used with great caution (2.9/1) to identify those activities such as commuter motoring, whose external costs exceed their net private benefits (2.9/2). This could be done by physical restraints, such as parking restrictions, or by making the external costs into private ones by some form of pricing (2.9/3).
2.10 I would, however, like to emphasise that many of the facilities generated by the accessibility within York depend on many people travelling to them using public transport, bikes or foot and whatever cost benefit analysis indicates we should (probably) not let the dispersive effect of the motor destroy them (2.10/1).
The enormous cost of cars in cities.
The European Commission study by Technoser on car-free cities, 1992
The report by Technoser was commissioned by Carlo Ripa di Meana in 1992. At the time he was the European Environment Commissioner. I now have a copy of the full report. It is in French and I am slowly working through it.
An excerpt from a press release from the European Commission at the time:
Based on these observations, Carlo RIPA di MEANA, the European Environment Commissioner, has had a study carried out on car-free cities in an attempt to find the answer to the following question: Is it possible, and if so to what extent, to conceive of a city which will operate more efficiently than the type of cities we have at present, using alternative means of transport to the private car?
The answer provided by the study is positive, even in purely financial terms: the car-free city costs between two and five times less (the costs varying depending on the population density of the city).
This report shows the enormous burden motorists put on the non-motorist. Probably the biggest cost is the costs of living in cities and towns that are being adapted for the sprawl and pollution caused by motorists. Time to think of #PedestrianApartheid, separate development for non-motorists.

