Carbon budgets, housing and transport
Written for a housing policy forum. Part 3
Some readers may have heard about a recent scientific paper
Emission budgets and pathways consistent with limiting warming to 1.5°C.
This paper estimated the remaining carbon budget to keep below a 1.5°C
temperature rise since pre-industrial times. It’s estimate is much larger than
that outlined in the IPCCs fifth report (AR5). Fact checks about this paper on
Carbon Brief and RealClimate show it should not be taken seriously.
UK Carbon budgets
The Climate Change Act of 2008 aimed to cut UK greenhouse gas emissions by 80% by 2050 in relation to emissions in 1990. Thes are measured in Carbon Dioxide Equivalent (CO2e), which also takes account of non-CO2 greenhouse gasses, such as methane. The starting figure in 1990 was 799 million tonnes CO2e. Roughly 12 tonnes CO2e per person per year. This gives the target for 2050 as 2.5 tonnes CO2e per person.
According to 2016 UK GREENHOUSE GAS EMISSIONS, PROVISIONAL FIGURES from the Department for Business Energy and Industrial Strategy, emissions for UK in 2016 had fallen to 466 million tonnes of CO2e or 7.28 tonnes per person.

The Carbon Budget 2016 from the Global Carbon Project gave the remaining carbon budget to keep the global temperature below 2°C as 816 billion tonnes of CO2. Adjustments and accounting for non-CO2 gasses means that averaged over the world’s population the budget is roughly 120 tonnes CO2e per person.
MORE…
The reductions in the 2008 Climate Act bust UK’s fair share
Starting now, if the UK’s carbon emissions were reduced by equal amounts each year until the target of 2.5 tonnes CO2e per person were reached in 2050, the average UK Citizen would have emitted 171 tonnes CO2e. Easily busting the “fair world share” of 120 tonnes CO2e per person.
That’s bad enough, but compare the graph from BEIS with one from a DEFRA, UK’s Carbon Footprint 1997 – 2014. This shows UK carbon emissions calculated on a consumption basis. These are not falling like the ‘official’ figures which are measured on a production basis. Measurements on a production basis do not count the embodied carbon in imports so that when UK steel works are shut, their emissions are no longer counted and the UK Carbon emissions decrease. Estimates of carbon emissions measured on a consumption basis will count the emissions caused by the replacement steel imported from overseas.
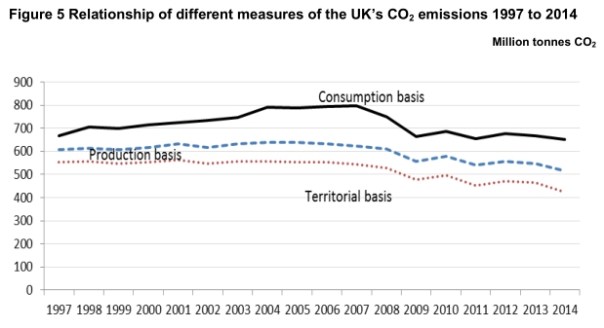
This graph shows carbon emissions which include the “embodied emissions” in imports. The Committee on Climate Change has also commissioned work embodied carbon. In Reducing the UK’s carbon footprint and managing competitiveness risks (April 2013) they say
UK’s carbon footprint. This has increased over the past two decades, as growth in imported emissions has more than offset reductions in production emissions. However, our analysis shows that offshoring of industry in response to low-carbon policies has had at most a minor impact in reducing production emissions, and that the carbon footprint would have increased more had production emissions not been reduced.
The latest annual report from the UN Environmental Program, says there is a “catastrophic climate gap” between the existing Paris Agreement commitments and the reductions required to avoid the worst of global warming. The above shows the UK is one of the worst climate offenders, our current lifestyles causing emissions way above our fair share.
Finding new ways of living is essential for the whole world. If the developing world continues to follow our path we have little hope in avoiding a catastrophic climate. One of the key elements is how we travel and how much we travel. In the UK we must set an example.
Air Travel

The United States Department of Transportation, Bureau of Transport statistics reports that the amount of passenger miles flown (Revenue Passenger-Miles) in aircraft in 2016 was 660,467,250,000 miles. At the time of writing Worldometers reports world population as 7,532,362,245: On average world citizens flew just 87.68 miles (141.11 kilometres). From other sources, I estimate that the distance flown by the average citizen of the USA is 1960 miles (3154 km). This is more than 20 times the world average.
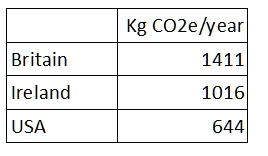
Calculating the greenhouse gas emissions from air travel is a topic of some dispute but in 2007 the Guardian reported research by Global TGI naming Britons as the world’s biggest emitters of CO2 from air travel:
The average carbon emission for each British flyer was 603kg a year, more than a third higher than Ireland in second place with 434kg and more than double that of the US at 275kg, in third place.
When these figures are converted to Carbon Dioxide Equivalent (CO2e) to take account of the extra greenhouse effects of air travel, yearly emissions become : Britain 1206 kg CO2e, Ireland 868 kg CO2e and US 550 kg CO2e. Adding 17% to account for increases in air travel sice 2017 gives the CO2e cause by the air travel of the average citizen as:
These emissions are impossible to fit into a future carbon ration for travel. For the year 2050, set in the UK Climate Change Act, the Green Ration Book estimates a budget of 550 kg CO2e for all travel emissions. There are many strands of argument in discussions of the global warming effects of air travel but whatever the detail and nuances, it is clear that the climate cannot sustain these levels of air travel using current airline technology. There seems little alternative than cutting down drastically on air travel, including air freight.
What has air travel to do with housing? Firstly, there is little point in building anything if we are heading for a sixth mass-extinction that greenhouse emissions could bring about as some scientists are predicting. Secondly, in a later note, I will describe local economic mechanisms and information systems to discourage air travel.
Car travel

This is an excerpt from my website nocars.org.uk (now archived on brusselsblog.uk)
Carbon emissions from making cars
A report by Climate Central, Roadmap to Climate-Friendly Cars: 2013, concludes
Our state-by-state analysis reveals that because the manufacturing of an electric car causes more greenhouse gas emissions than manufacturing a comparable gasoline-powered car, an electric car must be driven sufficiently long distances using sufficiently low-carbon electricity for it to have lower total lifecycle greenhouse gas emissions than the gasoline-fueled car.
They give carbon emissions from the manufacture of different types of car as (converted to metric tonnes CO2e):
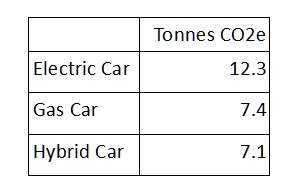
The UK Climate Change Act of 2008 aims to cut greenhouse gas emissions by 80% by 2050 to approximately 2.5 tonnes CO2e per year. At these estimates the emissions from the manufacture of an electric car are 5 years of this total budget. [Or 20 years of a travel budget if the total is divided equally into categories: food, housing, travel and an individual’s share of government emissions].
Carbon emissions from driving a car in a year
Tail pipe emissions from the SMMT for new cars in 2015 uprated a bit to 160 gm CO2/km – because published figures only account for measured tail-pipe emissions. They do not include emissions in processing and transporting oil. Distance per year for the average car is taken as 12,700 km
This makes just over 2 tonnes per year or 80% of the 2.5 tonnes per year the Climate Change Act of 2008 is aiming at for 2050…
Carbon emissions from driving an electric car in Maryland, USA
Driving Maryland’s average distance using electricity from Maryland’s electric grid in a Nissan Leaf electric car creates approximately 2.03 tonnes of CO2e.
In some US states grid electricity is much lower in carbon emissions. This is where electricity is supplied by a mixture of wind and solar power, hydroelectricity and nuclear power. Most electricity used in Vermont is from these sources. For this reason The Roadmap could estimate that emissions from driving a Nissan Leaf in Vermont creates less than 5 gm CO2e per kilometre. However, it was still reporting that the carbon emissions in making electric car was 12.3 tonnes CO2e.
It is possible that given time, the carbon emissions from manufacturing cars can be reduced dramatically. Hopeful signs are here. The Sun reports

Take the “making the car is carbon neutral” with a pinch of salt – life cycle studies (e.g. 1, 2) indicate that the composite materials using hemp fibre that can be used in car manufacture are not yet carbon neutral and other components of this car, such as the engine, are certainly not.
It will be a long time before a car with top speed 70+ mph, to carry 4 or 5 people with 100kgs of luggage can be anything like carbon neutral. In the mean time the mass use of such vehicles will put an unacceptable strain on carbon budgets.
In the medium term, mass car transport is incompatible with avoiding dangerous climate change. Future developments may change that but these developments are unlikely to come in time. (See Had we but world enough and time.)
Buses, trains, ships and lorries.
As discussed above, air travel and the mass use of private cars must be greatly reduced to be compatible with avoiding dangerous climate change. However, a comparison of car emissions with other forms of transport is informative. The following figures have been updated from The Green Ration Book for carbon emissions for passenger transport. They not include the emissions from manufacture.
![]()
Although buses have a higher carbon footprints than cars that carry three passengers, they are not so much of a concern because the average length of a bus journey is less than a fiftieth of the average car journey. Cars enable people to live far from work, school and amenities and so encourage urban sprawl. In addition their embodied carbon from the manufacture of the bus is spread over many more passenger journeys.
Freight transport
The emissions from freight transport are important also. One way of looking at freight transport is to calculate the distance travelled when the weight of the load carried is the same as the weight of the Carbon Dioxide emitted. Call this the Emission Distance Index (EDI). The Green Ration Book estimated the table below. As an example, the 1000 kilometres given for air freight means that carrying 1 tonne of freight produces 1 tonne of CO2 for each 1000 kilometres travelled.

Note: The Emissions Distance Index
The EDI provides an easy way to get a basic estimate of the CO2 created in transporting goods. For example the sea distance from Shanghai to Tilbury is nearly 20,000 kilometers via the Suez Canal. The CO2 emitted carrying 10 tonnes of goods calculates as 3.5 tonnes CO2 (10*20,000/57,000 tonnes) about a third of the weight of the goods.
By a similar calculation the air transport of a bunch of 12 cut roses, weighing 600gm flown 6,800 kilometers from Nairobi to London creates just over 4 kg of CO2 (600*6,800/1000 grammes). That is over six times the weight of the flowers. Although this method is rough and ready, it does give a general sense of the size of CO2 from different types of freight transport.
The message is clear: Don’t send goods by air and, where possible, don’t send them long distances by road. So, if we want to play our part in saving the planet, we must cut out most flying for passengers and freight. We must also embrace lifestyles that are not dependent on the private motor car. For the medium term, we should travel less.
We should redesign the way we live. Town planning in Britain has had a world wide influence, as Barry Michael Levine says in British New Town Planning : A Wave of the Future or a Ripple across the Atlantic (1983) …
The British experience with new town planning has had global effects. The ripple of reform which started in postwar England has already reached distant shores, and although its domestic impact has recently waned, there can be no doubt that new town planning appears as an important wave of the twenty-first century.
On a world scale, if all the families dragged out of poverty have a car, live in brick or concrete homes and eat beef, the world doesn’t stand much chance.
More of this in later notes, which will discuss car-free living and car-free cities.
